Christian Forums

This is a sample guest message. Register a free account today to become a member! Once signed in, you'll be able to participate on this site by adding your own topics and posts, as well as connect with other members through your own private inbox!

  • Are you taking the time to pray? Christ is the answer in times of need

    https://christianforums.net/threads/psalm-70-1-save-me-o-god-lord-help-me-now.108509/

  • The Gospel of Jesus Christ

    Heard of "The Gospel"? Want to know more?

    There is salvation in no other, for there is not another name under heaven having been given among men, by which it behooves us to be saved."

  • Looking to grow in the word of God more?

    See our Bible Studies and Devotionals sections in Christian Growth

  • Focus on the Family

    Strengthening families through biblical principles.

    Focus on the Family addresses the use of biblical principles in parenting and marriage to strengthen the family.

  • Have questions about the Christian faith?

    Come ask us what's on your mind in Questions and Answers

  • How are famous preachers sometimes effected by sin?

    Join Sola Scriptura for a discussion on the subject

    https://christianforums.net/threads/anointed-preaching-teaching.109331/#post-1912042

[_ Old Earth _] Revised Carbon 14 testing

Yeah, but notice the tight correlation of the C14 based dating and very
loose correlation of the 230Th/234U dating.
This is my point. All the C14 based dating methods are tightly correlated
(which is expected in my hypothesis), but using another dating method
indicates huge discordance between the two.
Huge discordance? Hardly. The U/Th dating is inaccurate in this case, but it falls well in line with the C14 dates. Also check the lake suigetsu graph again, it contains U/Th dates as well.

And why is it expected that the C14 dates are so close to each other according to your hypothesis? These are raw data which are not calibrated against each other, as previously mentioned.

Notice the tighter correlations the younger the dates become. This exactly
the opposite of what is expected. The older dates contain more
230Th, and thus less probablity for false readings. Yet the older dates are
much less correlated than the younger dates. This smacks of cherry picking
the earlier dates.
Or it's just coincidence due to the relatively low number of samples. Saying that the author cherry picked data is a tough accusation. And if he did that, why would he do that in this particular way? Sorry, but that does not make any sense!

The carbon containing biomass is buried and no longer able to exchange
with the atmosphere (carbon sink).
Then that drop wouldn't happen during the flood though, but slowly afterwards. The buried carbon wasn't part of the atmosphere after all, the atmosphere only lost its "supplier" with carbon (methane from decaying biomass). So tthe flood model does not predict a rapid sink of CO2 levels during the flood.
It'd even predict a rapid increase right after the flood, as an unusual amout of bio mass which did not get buried decays at once. Only after this a slow decrease as carbon is bound in newly growing biomass would happen.

Uniformitarian assumptions do not predict this rapid drop in historical
atmospheric CO2 levels.
What is rapid in this context? The diagram, dealing with hundreds of millions of years doesn't really show a "rapid" drop.
For this happening in a single year you need other evidence than a diagram from mainstream geology...
 
Huge discordance? Hardly. The U/Th dating is inaccurate in this case, but it falls well in line with the C14 dates. Also check the lake suigetsu graph again, it contains U/Th dates as well.

And why is it expected that the C14 dates are so close to each other according to your hypothesis? These are raw data which are not calibrated against each other, as previously mentioned.

Because they are all the same relative date, but the dates are not

absolute.


That was the point to begin with...lol, way back when. I almost forgot the

point.

C14 dates are relative, but not absolute, because of the uniformatarian

assumptions involved in the current method. Most scientists that use this

method (i.e.- archeologists) regularly understand this, and usually just

report their dates uncalibrated. C14 dating is a good relative dating tool, but

not absolute.
 
Because they are all the same relative date, but the dates are not
absolute.
And hence one calibrates it, to get what quite certainly is an absolute date.

If all dating methods were perfectly absolute, they'd all perfectly agree within the error margin of the measuring instruments. That's not the case, as you can see in the above graphs, but they agree very closely. So if you have an explaination for that other than the "uniformitarian" assumptions being very accurate, i'd like to hear it. When exactly were they put off, and how so? And why were indendent things like coral growth and the formation of lake varves affected by the same degree`and at the same time? Keep in mind, in case of the varves the flood is not a possible explaination as everything must have happened post flood if one hypothesizes that there was one, else the model is inherently self contradictive.

Most scientists that use this
method (i.e.- archeologists) regularly understand this, and usually just
report their dates unclibrated.
Source for this claim?

C14 dating is a good relative dating tool, but
not absolute.
So where exactly does it begin to be off? Objects of known old age have been dated with it and gave good results. For until when do you accept it as being at least "close to absolute"?
 
jwu:

And hence one calibrates it, to get what quite certainly is an absolute date.

If all dating methods were perfectly absolute, they'd all perfectly agree within the error margin of the measuring instruments. That's not the case, as you can see in the above graphs, but they agree very closely. So if you have an explaination for that other than the "uniformitarian" assumptions being very accurate, i'd like to hear it. When exactly were they put off, and how so? And why were indendent things like coral growth and the formation of lake varves affected by the same degree`and at the same time? Keep in mind, in case of the varves the flood is not a possible explaination as everything must have happened post flood if one hypothesizes that there
was one, else the model is inherently self contradictive.

Comparison of ancient, historically dated artifacts (from Egypt, for example) with their radiocarbon dates has revealed that radiocarbon years and calendar years are not the same even for the last 5,000 calendar years. Since no reliable historically dated artifacts exist which are older than 5,000 years, it has not been possible to determine the relationship of radiocarbon years to calendar years for objects which yield dates of tens of thousands of radiocarbon years. Thus, it is possible (and, given the Flood, probable) that materials which give radiocarbon dates of tens of thousands of radiocarbon years could have true ages of many fewer calendar years.

Gerald A. Aardsma, Ph.D, Nuclear Physics
University of Toronto

He received his Ph.D. from the University of Toronto doing research in

accelerator mass spectrometry.


Studies have shown that varve counts vary between individual locations in modern glacial lakes. Sometimes, the number of laminae covering a historically dated level was more than the elapsed years.

The Green River oil shales have provided one of the very strongest arguments for millions of years, or at least one of the most used.

Take a specimen of the shale and slice it open perpendicular to the normal bedding, so that you look at the rock's internal characteristics from the side. You will see a multitude of tiny laminations, like pages in a book, but alternating light and dark. Each pair is called a varve usually interpreted as representing a yearly cycle of deposition, with the darker, coarser layer the summer deposit, and the lighter, finer layer from the winter. In the Green River shale deposits up to 6 million varves are found. Does this prove 6 million years?

Actually, in no location do all the varves exist. The total is derived by correlating sequences from several locations, arranging the partial records in consecutive order. Obviously, conclusions are subjective.

The real question is, does each varve unequivocally represent one year? Definitely not, for several reasons. Studies have shown that varve counts vary between individual locations in modern glacial lakes. Sometimes, the number of laminae covering a historically dated level was more than the elapsed years. One study in a modern lake documented that 300-360 laminae had formed in 160 years. In the Green River Shale a 35% variance in number occurred between two "instantaneous" volcanic ash falls. "All" researchers now recognize that sometimes more than one varve can form in a single year.

There's also evidence it happened rapidly. Numerous fossils are found in the Green River Formation. Catfish in abundance are found, looking much the same as they did when alive. The thickness of their bodies transgresses several layers. Obviously a fish carcass, even if it did get to the bottom of a lake would not remain undecayed and unscavenged for several years, slowly being covered by seasonal deposits.

Even more remarkable are an abundance of bird fossils. In spite of their low density, bird fossils are copiously present here. If these sediments are from the bottom of a calm lake, as required by the standard varve interpretation, how could myriads of bird fossils be present? Bird carcasses don't lie on the bottom of a lake. What happened?


Further evidence against the uniformitarian, calm lake model comes from the nature of the sediments. The dark summer layer is organic rich, a commercial source of oil today. Organic material does exist in modern lakes, but a huge lake without disruptive storms or variable river input, year after year for six million years? Surely some things cannot be.

On the other hand, numerous examples of catastrophic deposits, hurricane debris, 90 mph mudflows at Mount St. Helens, and laboratory experiments, have documented rapid formation of multitudes of "varves." A detailed understanding of past, unobserved events is hard to construct, but in general, the Green River varved deposits support the global Flood of Noah's day model much better than the uniformitarian, long age model.

(emphasis added)


Dr. John D. Morris, Ph.D. Geological Engineering


charlie:

Most scientists that use this method (i.e.- archeologists) regularly

understand this, and usually just report their dates uncalibrated.


Source for this claim?

http://www.tsha.utexas.edu/handbook/onl ... /bbw3.html

In this article, research from Dr. Mike Collin's and crew (leading

archeologists in North American Paleo-Indian cultures) report their dates in

uncalibrated dates. For example, the sparse assemblage of Clovis artifacts

are reported at 11,000 years ago. The Clovis culture is reported by

journalists and others in calibrated years: 13,500 years ago.

http://en.wikipedia.org/wiki/Clovis_culture


In another one of Mike's research projects in Central Texas, The Gault Site.

he again reports the Clovis finds at 11,000 years, which is uncalibrated:

http://www.utexas.edu/research/tarl/res ... /intro.htm


Dr. Mike waters and crew from Texas A&M's Center for the Study of the First

Americans also reports their research in uncalibrated years:


http://anthropology.tamu.edu/faculty/th ... oE-Abs.pdf

Whereas, other sources reporting their finds and commenting on the same

eras, reports the dates in "calibrated" and uncalibrated years:

http://en.wikipedia.org/wiki/Holocene

Why do you think these researchers only report their findings in uncalibrated

terms, if current calibration methods are accurate? One might as well go

ahead and report the "calibrated" dates if one is confident of current

calibration techniques.

These researchers are being intellectually honest, and just reporting their

finds, leaving the interpretation of absolute dates up to the individual

reader.

Again, as I stated before, C14 dates are a great tool for relative dating, but

not absolute dating.


jwu:

So where exactly does it begin to be off? Objects of known old age have been dated with it and gave

good results. For until when do you accept it as being at least "close to absolute"?

C14-Dates inaccurate - Calibration procedure disproved
Added: (Tue Apr 11 2006)


The content of radiocarbon allows to determine the age of organic material - after calibration with an empirically found, highly irregular 'calibration curve'. The physicist Hans-E. Korth, a pensionist from IBM-Research, has given proof that the assumptions for the actual calibration curve are in conflict with the observations of physics and the laws of statistics. Participants of the 19th 14C Conference being held at Oxford last week acknowledged his open letter questioning half a century's work of the scientists.


Dramatic variations of C14 within the atmosphere which had been presumed are incompatible with a physically conclusive interpretation of the measured data. Korth shows the strange consequences of this assumption for the production of C14. He presents more evidence displaying the very unlikely apparent interdependency between C14 in the atmosphere and the temperature on the Earth's surface.
Additional proof
gives a look at the deviation between the C14 age values from sediments, in comparison to those from wood. Then there is the extremely uneven age distribution of wood-sample inventories. "Secular variations of C14 were considered real," explains Korth, "while the bizarre consequences of calibration were ignored: Samples of wood from the middle-ages distribute uniformly along the time-axis, when calibration is omitted.
After calibration, the sample distribution shows so large variations that a coincidence must be excluded. Another example: C14 is produced by the radiation of our sun. The consequence of the apparent C14-variations were three distinct radiation levels for the sun, switching from one
into an other after a few decades. Do we need to believe this?"


The consequences of these findings are crucial for science: A first conclusion will be that the observed deviations of C14 dates are due to mismatches of tree-ring sequences within dendrochronology, as both methods are linked by the calibration process. Investigations indicate that today's dendrochronologies include a surplus of some 300 tree-rings.

This confirms the much disputed hypothesis of H. Illig. For more than 15 years, the German chronologist has addressed the complete lack of reliably dated artefacts from the three 'dark' centuries of the early middle-ages and many other observations, leaving no other conclusion than to deny the historical reality of this period.

The general implications of this discovery should not be underestimated: For most of us, it may be not really important whether Charlemagne, for example, has ever lived. However, to predict the accelerating warm-up of the Earth's climate reliably, accurate data from the past are needed. These are of prime importance for upcoming political decisions.


More Infos:
http://www.korthweb.de/PhZT/An_open_let ... rence.html
(For verification, please ask a physicist for his explanation of the itemised facts and data)

Programme & contributors: http://www.rlaha.ox.ac.uk/c14/conference19/prog.html
FAQ on critical chronology of the early middle-ages http://www.PhZT-FAQ.de.vu

Contact: H-E. Korth, korth@t-online.de
Sandbergerstr. 34, D-70184 Stuttgart, Germany

In my humble opinion, I think C14 dating can be reasonably calibrated as

far as historically , independently documented artifacts date back in time.

From there, it’s all guesswork...not science.

Apparently there are a number of very "high end" scientists trying to answer

this very question. Sounds like we're both headed in the right direction:

questioning current assumptions.

While attending The University of Texas in Austin in my college days, the

common mantra pounded into our heads was : Question Authority.
 
And how far would that be? Do people actually have to be present, or do tree rings from a single tree (not a sequence of various trees, albeit the method is sound) count in your books as well?


Comparison of ancient, historically dated artifacts (from Egypt, for example) with their radiocarbon dates has revealed that radiocarbon years and calendar years are not the same even for the last 5,000 calendar years. Since no reliable historically dated artifacts exist which are older than 5,000 years, it has not been possible to determine the relationship of radiocarbon years to calendar years for objects which yield dates of tens of thousands of radiocarbon years. Thus, it is possible (and, given the Flood, probable) that materials which give radiocarbon dates of tens of thousands of radiocarbon years could have true ages of many fewer calendar years.
This presupposes "the flood". And as seen on the lake suigetsu dates, the flood has no bearing anyway, as anything which put it off would have to have happened after the flood.

And by the way...5000 years? That's 600 years too many.

Actually, in no location do all the varves exist. The total is derived by correlating sequences from several locations, arranging the partial records in consecutive order. Obviously, conclusions are subjective.
THat's about green river, not subject of this thread.


We've already talked about green river, this is not relevant to lake suigetsu at all.

Sometimes, the number of laminae covering a historically dated level was more than the elapsed years. One study in a modern lake documented that 300-360 laminae had formed in 160 years. In the Green River Shale a 35% variance in number occurred between two "instantaneous" volcanic ash falls. "All" researchers now recognize that sometimes more than one varve can form in a single year.
How many? Two per year? You need hundreds or even tens of thousands!

On the other hand, numerous examples of catastrophic deposits, hurricane debris, 90 mph mudflows at Mount St. Helens, and laboratory experiments, have documented rapid formation of multitudes of "varves."
Which are the result of hydrodynamics and sedimentation, and not like the varves of lake suigetsu at all. The name "varve" as in "layer" is all they have in common. The suigestu varves clearly show the passing of seasons - pollen, algae growth and so on.


http://www.tsha.utexas.edu/handbook/online/articles/WW/bbw3.html
In this article, research from Dr. Mike Collin's and crew (leading
archeologists in North American Paleo-Indian cultures) report their dates in
uncalibrated dates. For example, the sparse assemblage of Clovis artifacts
are reported at 11,000 years ago. The Clovis culture is reported by
journalists and others in calibrated years: 13,500 years ago.
http://en.wikipedia.org/wiki/Clovis_culture
That's two groups, hardly "most archeologists".

Why do you think these researchers only report their findings in uncalibrated terms, if current calibration methods are accurate? One might as well go ahead and report the "calibrated" dates if one is confident of current calibration techniques.
Because it's part of "etiquette" to provide the whole data, both the raw and the interpreted. Else no-one can check it in peer review. And calibration curves of course can be updated when new data is discovered, then readers need the raw data.

Additional proof
gives a look at the deviation between the C14 age values from sediments, in comparison to those from wood. Then there is the extremely uneven age distribution of wood-sample inventories. "Secular variations of C14 were considered real," explains Korth, "while the bizarre consequences of calibration were ignored: Samples of wood from the middle-ages distribute uniformly along the time-axis, when calibration is omitted.


After calibration, the sample distribution shows so large variations that a coincidence must be excluded. Another example: C14 is produced by the radiation of our sun. The consequence of the apparent C14-variations were three distinct radiation levels for the sun, switching from one
into an other after a few decades. Do we need to believe this?"
So where can i actually see this data?


This confirms the much disputed hypothesis of H. Illig. For more than 15 years, the German chronologist has addressed the complete lack of reliably dated artefacts from the three 'dark' centuries of the early middle-ages and many other observations, leaving no other conclusion than to deny the historical reality of this period.
That man is a well known crackpot...conspiracy theory galore. Basically, according to him, the europeans could convince the Chinese, Muslims, Hindus and Hebrews to skip 300 years in their calenders as well. And who cares if there are hardly any relics from the dark ages as long as the years were counted and there are tons of things older than that which were dated correctly. Apparently those 700A.D. conspirators also had the know how to put the datings of all not even yet dug out Roman artifacts off by 300 extra years...e.g. the Ar/Ar dating of the destruction of pompeji, known to have occured in 79AD, which gave a result only 7 years off.

This is about a measily 300 years of deviation by the way! Not anywhere near the order of magnitude of being off that you need!

However, let's finish with the lake suigetsu situation first...then we can continue with that topic.
 
This presupposes "the flood". And as seen on the lake suigetsu dates, the flood has no bearing anyway, as anything which put it off would have to have happened after the flood.

And by the way...5000 years? That's 600 years too many.

O.K., if your going to nickel and dime me, you rascal, then, yes it's 600

more than the low end interpretation of when the hypothesized flood

occured. Even within ID circles, there is much debate of when the flood

occured: 4500- 5500 years. To me, this is splitting hairs.

Why do you think "varves" could not be fine sedimentary layers laid down in

the waning years of the flood. Varves are very similar to the evaporite

strata laid down in the Permian, a time of waning seas, and the waxing and

waning while the seas obtained equilibrium. This follows even by

comtemporary geologic theory.

We've already talked about green river, this is not relevant to lake suigetsu

at all.

Why not. Are they not assumed by uniformitarian theory to be formed by

the same processes? Or, is this cherry picking (i.e.- Green River doesn't fit

our predictions, so lets find a varve starta that does)?


...but a huge lake without disruptive storms or variable river input,

year after year for six million years? Surely some things cannot be...

What do you make of this quote by Dr. John Morris?


That's two groups, hardly "most archeologists".

I don't have time to quote them all, but I'm sure you could research other

leading archeologists, and see how they report their dates.

Because it's part of "etiquette" to provide the whole data, both the raw and the interpreted. Else no-one can check it in peer review. And calibration curves of course can be updated when new data is discovered, then readers need the raw data.

Exactly. That's what's discussed in the 19th 14C Conference being held at

Oxford. Something ain't jiving, and they know it.

That man is a well known crackpot...conspiracy theory galore.


That's why the 19th 14C Conference is seriously discussing his hypothesis?

I don't understand the logical flow of the arguement you presented....?


This is about a measily 300 years of deviation by the way!

300/800 years = 37.5% deviation. Imagine as one goes further back in

time (i.e.- 10,000 rcybp).


where can i actually see this data?

The link's at the bottom of the article.
 
O.K., if your going to nickel and dime me, you rascal, then, yes it's 600
more than the low end interpretation of when the hypothesized flood
occured. Even within ID circles, there is much debate of when the flood
occured: 4500- 5500 years. To me, this is splitting hairs.
*Shrugs*, it conflicted with the 2400BC date which you mentioned, so i pointed this out.

Why do you think "varves" could not be fine sedimentary layers laid down in
the waning years of the flood.
Because there is no reason why they should be confined to these lakes then, and there is no reason why flood varves should look exactly like annual sedimentation varves.

Varves are very similar to the evaporite strata laid down in the Permian, a time of waning seas, and the waxing and
waning while the seas obtained equilibrium. This follows even by
comtemporary geologic theory.
Not at all!
The varves of lake suigetsu contain pollen, they contain remains of algae, and the remains of other organisms which clearly indicate a seasonal origin.

Evaporite varves are completely different.


Why not. Are they not assumed by uniformitarian theory to be formed by the same processes? Or, is this cherry picking (i.e.- Green River doesn't fit

our predictions, so lets find a varve starta that does)?
Because it's a red herring and we've already talked about this in the past. Furthermore, in green river we don't have datings of the individual varves.

[quote:33934]..but a huge lake without disruptive storms or variable river input,
year after year for six million years? Surely some things cannot be...[quote:33934]


What do you make of this quote by Dr. John Morris?
No-one denies that storms and so on happen. But these do not produce the same varves as seasonal change does.

The left are storm/flood varves, the right are annual varves:
Walensee2.jpg

Quite different, aren't they?

That's why the 19th 14C Conference is seriously discussing his hypothesis?
[/quote:33934][/quote:33934]Do they? Perhaps i missed it, but it doesn't seem to have made it onto the schedule which you linked to. The other thing is just an "open letter" to them.

Illig is a crackpot. If he were correct and the years 619-919 never happened, how come the Islamic part of the world took part in that prank? We've living in the year 1426 of the muslimic calender now, so they neccessarily must have taken part in that conspiracy. Korth basically bases his 300 years dendrochronology claim extrapolation on merely two local minima of the calibration curve and a rough repetition between 600 and 900 ...that holds about as much water as the shrinking sun claim.
 
jwu:

Illig is a crackpot. If he were correct and the years 619-919 never happened, how come the Islamic part of the world took part in that prank? We've living in the year 1426 of the muslimic calender now, so they neccessarily must have taken part in that conspiracy. Korth basically bases his 300 years dendrochronology claim extrapolation on merely two local minima of the calibration curve and a rough repetition between 600 and 900 ...that holds about as much water as the shrinking sun claim.

Strawman? :-?


Additional proof gives a look at the deviation between the C14 age values from sediments, in comparison to those from wood. Then there is the extremely uneven age distribution of wood-sample inventories. "Secular variations of C14 were considered real," explains Korth, "while the bizarre consequences of calibration were ignored: Samples of wood from the middle-ages distribute uniformly along the time-axis, when calibration is omitted.
After calibration, the sample distribution shows so large variations that a coincidence must be excluded.
Another example: C14 is produced by the radiation of our sun. The consequence of the apparent C14-variations were three distinct radiation levels for the sun, switching from one
into an other after a few decades. Do we need to believe this?"


I think you missed my point. I was stressing that the conference is

addressing the invalidity of current calibration procedures due to varying

historical atmospheric C14/C12 ratios. This is a prediction the Catastrophic

Model makes (i.e.- affirmation), but this is an important instance where

Uniformitarian predictions fail (i.e.- falsification). Even if Illig's interpretation

of this data is crazy, the fact remains that C14/C12 ratios have varied

considerably, even in the very recent past.


jwu:

The left are storm/flood varves, the right are annual varves:

How about a comparison between Green River and Lake Zurich. Your

comparing apple and oranges.

Again, Strawman? :-?

‘There are more than a million vertically superimposed varve pairs in some parts of the Green River Formation. These varve deposits are almost certainly fossil lake-bottom sediments. If so, each pair of sediment layers represents an annual deposit . . . . The total number of varve pairs indicates that the lakes existed for a few million years.

D.A. Young,‘The discovery of terrestrial history’

Univ. N.C. at Wilmington, Dep. Earth Sci., Wilmington, N.C


Not at all!

The varves of lake suigetsu contain pollen, they contain remains of algae,

and the remains of other organisms which clearly indicate a seasonal origin.

Evaporite varves are completely different.

(Emphasis added)

Are they...source??

They appear to be created by very similar hydraulic processes.


Also, interestingly, yes varves do contain biological matter...that

transgress too many layers contemporaneously to be considered an

annual event. Obviously, from the evidence of very well preserved

organisms transgressing many varves, varve formation is very rapid

and catastrophic in nature.
 
Strawman?
How so? Please be detailed. I think it's a conclusive falsification of Illig's ideas.

I think you missed my point. I was stressing that the conference is
addressing the invalidity of current calibration procedures due to varying
historical atmospheric C14/C12 ratios. This is a prediction the Catastrophic
Model makes (i.e.- affirmation), but this is an important instance where
Uniformitarian predictions fail (i.e.- falsification).
Where is this on the conference's schedule?

And besides, variations are long well known, hence the use of calibration curves in first instance.

Even if Illig's interpretation
of this data is crazy, the fact remains that C14/C12 ratios have varied
considerably, even in the very recent past.
What do you consider "considerably"?

How about a comparison between Green River and Lake Zurich. Your
comparing apple and oranges.
Again, Strawman?
Are you saying that at green river storm varves do look like annual varves at some places such as green river but they don't look like elsewhere that at all? Why would that be so? That does not make any sense...

That couldn't possibly be a straw man by the way. A straw man is argueing against a distorted and weaker version of the opponent's argument. I,e. "evolution says dogs give birth to cats", or "christianity says we have to eat human flesh"

They appear to be created by very similar hydraulic processes.
Not at all!

Evaporites are the result of lakes drying out. They consist of minerals which were solved in the water, as well as anything else it contained. They do not represent the order of biological processes in any way, such as pollen in spring, then later algae remains from summer and the small particles whcih settle down during the calm period in winter.
On contrast, annual varves are the result of precipitation of particles in the lake, which vary according to whatever is currently solved or floating in it.

Also, interestingly, yes varves do contain biological matter...that
transgress too many layers contemporaneously to be considered an
annual event. Obviously, from the evidence of very well preserved
organisms transgressing many varves, varve formation is very rapid
and catastrophic in nature.
Such think can have been buried by local events (nice seasonal layers in between falsifying the concept that it was all once event).
Furthermore, all it takes is a sufficiently anaerobic environment for corpses to remain as they are for years. A low content of oxygen in the deep parts of the river basin and these fossils are not a mystery at all.
That's how we see things being preserved for years today as well.

Besides, it's a tertiary formation, so even according to your own model as you have provided it so far "the flood" is out of question as an explaination of the formation.
 
charlie:

Strawman?

jwu:

How so? Please be detailed.


...Additional proof gives a look at the deviation between the C14 age values from sediments, in comparison to those from wood. Then there is the extremely uneven age distribution of wood-sample inventories. "Secular variations of C14 were considered real," explains Korth, "while the bizarre consequences of calibration were ignored: Samples of wood from the middle-ages distribute uniformly along the time-axis, when calibration is omitted.
After calibration, the sample distribution shows so large variations that a coincidence must be excluded. Another example: C14 is produced by the radiation of our sun. The consequence of the apparent C14-variations were three distinct radiation levels for the sun, switching from one
into an other after a few decades. Do we need to believe this?"...


The emphasis added in my post was only Korth’s opinions, not Illig’s.

Korth does not say he agrees with Illig’s interpretation, but agrees that Illig

had noted the C14 discrepancy.

Instead, though, you make Illig’s crazy interpretation the strawman, when in

fact my point was there’s evidence of varying C14/C12 ratios in the recent

past.


The link that you read and to which you referred had the following topics of

discussion scheduled for the 19th International 14C Conference:

1. C14 concentrations of consecutive 40 single-yr tree rings at a peak area in the excess region between 2800 and 2625 cal BP using AMS.
2. Variations in atmospheric 14C during the Younger Dryas from Huon pine tree rings in Tasmania
3. Is it possible to find a good point estimate of calibrated radiocarbon date?
4. Wiggle-matching 14C-dating of historical materials and the systematic error consideration.
5. Exploring the potential causes of atmospheric Δ14C variation using multi-proxy evidence from Bahamian speleothems (34 to 45 ka)
6. Δ14C of Atmospheric CO2 over the Subtropical and Equatorial Pacific from Fall 2002 to Winter 2004
7. Atmospheric 14CO2 changes in the equatorial zone of western Pacific since 1994
8. Two decades of regular observations of 14CO2 and 13CO2 content in atmospheric carbon dioxide in central Europe: long-term changes of
regional anthropogenic CO2 emissions.
9. Radiocarbon ?Wiggles? in Great Lakes wood c. 10,000 to 12,000 BP.
10. Forty years of atmospheric radiocarbon variation studies in Slovakia.
11. North Atlantic surface ocean radiocarbon reservoir age variation: links to rapid global climate change
12. A radiocarbon shift in the eastern tropical Pacific during the early 19th century - oceanic response to atmospheric forcing?
13. Large 14C fluctuations in core PS2644 between 55 and 80 cal ka BP: Real or not?
14. Radiocarbon changes in the Northeast Atlantic Ocean over the past 50 years
15. What do carbon isotopes tell us about the age and source of CO2 lost by evasion from surface waters draining peatlands?
16. Monitoring of atmospheric excess 14C around Paks NPP

Here’s the link again for convenience:

http://www.rlaha.ox.ac.uk/c14/conference19/prog.html

So, in summary, and to answer your question at hand:

You did not refute my point. Instead, you set up Illig’s crazy interpretations

as a strawman.

My point was that the conference is addressing the invalidity of current

calibration procedures due to varying historical atmospheric C14/C12 ratios.

This is a prediction the Catastrophic Model makes (i.e.- affirmation), but

this is an important instance where

Uniformitarian predictions fail (i.e.- falsification).


jwu:

Where is this on the conference's schedule?

17. C14 concentrations of consecutive 40 single-yr tree rings at a peak area in the excess region between 2800 and 2625 cal BP using AMS.
18. Variations in atmospheric 14C during the Younger Dryas from Huon pine tree rings in Tasmania
19. Is it possible to find a good point estimate of calibrated radiocarbon date?
20. Wiggle-matching 14C-dating of historical materials and the systematic error consideration.
21. Exploring the potential causes of atmospheric Δ14C variation using multi-proxy evidence from Bahamian speleothems (34 to 45 ka)
22. Δ14C of Atmospheric CO2 over the Subtropical and Equatorial Pacific from Fall 2002 to Winter 2004
23. Atmospheric 14CO2 changes in the equatorial zone of western Pacific since 1994
24. Two decades of regular observations of 14CO2 and 13CO2 content in atmospheric carbon dioxide in central Europe: long-term changes of
regional anthropogenic CO2 emissions.
25. Radiocarbon ?Wiggles? in Great Lakes wood c. 10,000 to 12,000 BP.
26. Forty years of atmospheric radiocarbon variation studies in Slovakia.
27. North Atlantic surface ocean radiocarbon reservoir age variation: links to rapid global climate change
28. A radiocarbon shift in the eastern tropical Pacific during the early 19th century - oceanic response to atmospheric forcing?
29. Large 14C fluctuations in core PS2644 between 55 and 80 cal ka BP: Real or not?
30. Radiocarbon changes in the Northeast Atlantic Ocean over the past 50 years
31. What do carbon isotopes tell us about the age and source of CO2 lost by evasion from surface waters draining peatlands?
32. Monitoring of atmospheric excess 14C around Paks NPP


charlie:
Even if Illig's interpretation
of this data is crazy, the fact remains that C14/C12 ratios have varied
considerably, even in the very recent past.

jwu:
What do you consider "considerably"?

23 % just over the last 1300 years (300/1300=23%)

jwu:
Are you saying that at green river storm varves do look like annual varves at some places such as green river but they don't look like elsewhere that at all? Why would that be so? That does not make any sense...

That couldn't possibly be a straw man by the way. A straw man is argueing against a distorted and weaker version of the opponent's argument. I,e. "evolution says dogs give birth to cats", or "christianity says we have to eat human flesh"

jwu:

The left are storm/flood varves, the right are annual varves:


charlie:

How about a comparison between Green River and Lake Zurich. Your

comparing apple and oranges.

Here’s an uniformatarian comparison of The Green River Varves and Lake

Zurich (which is the appropriate comparision):

The famous Green River formation covers tens of thousands of square miles. In places, it contains about 20 million varves, each varve consisting of a thin layer of fine light sediment and an even thinner layer of finer dark sediment. According to the conventional geologic interpretation, the layers are sediments laid down in a complex of ancient freshwater lakes. The coarser light sediments were laid down during the summer, when streams poured run-off water into the lake. The fine dark sediments were laid down in the winter, when there was less run-off. (The process can be observed in modern freshwater lakes.) If this interpretation is correct, the varves of the Green River formation must have formed over a period of 20 million years.
Bob Schadewald
Board of Directors, National Center for Science Education

Figure 4 shows varves from the mesotrophic Lake Zurich where the light laminae represent chemical sedimentation prevailing during summers and the darker
laminae detrital sedimentation during winters.

http://home.entouch.net/dmd/age.htm

Note that each varve formation is created by the same hypothesized

alternating winter and summer layers.

Why I was pointing out your strawman arguement, is you compared Lake

Zurich’s alternating sequence to Lake Walensee Storm Varves.

This was in an attempt to refute my point that Green River’s supposed

annual layers are pentrated by fish and birds, transgressing multiple

“annual†varves.

You attempted to refute my point by setting up Lake Walensee storm

varves as a strawman, when in fact, Green River varves are accepted by

contemporary geologists as an “annual†varve sequence.

I don't think you intended to do this, but the

result still was a strawman response.


Furthermore, all it takes is a sufficiently anaerobic environment for corpses to remain as they are for years. A low content of oxygen in the deep parts of the river

basin and these fossils are not a mystery at all.

That's how we see things being preserved for years today as well.

Fish should not remain intact while very thin varves are slowly being

deposited around them. Even in anaerobic waters, one would not expect,

say a catfish with a 5†diameter (small to medium sized fish) to not decay

for 5 years.

If so, there would be many, many more catfish in the varves, especially

intepreting the varves as forming over millions of years. The fossil record in

these varves does not support this hypothesis.

Now, do we see annual varves accumulating today which also have

interbedded dead fish which might potentially become fossils under the right

conditions?

For varve theory to survive, a credible, observable, repeatable

model/mechanism for the preservation of dead fish until they

eventually get buried is required. Is this phenomena in process today and

where it can be observed?

In the Green River Formation ‘evaporites are succeeded by laminates

bearing fresh water fish fossils but barren of autochthonous benthic [natural

bottom] fossils’.

Boyer, B.W., Green River laminites: does the Playa-Lake Model really invalidate the Stratified-Lake Model? Geology 10(6):321-324, 1982, and references cited therein.

Furthermore, fish fossil density varies dramatically in vertical profile with

practically no change in lamina character.

In regards to the fossil fish of the Green River Formation, or any formation for that matter, fish taphonomy can aid in refining environmental interpretations. This is because modern analogues indicate that fossil preservation can be traced to several fairly recognizable conditions. Tetany is the extreme contraction of muscles during death, and indicates traumatic death. The muscular contractions of the death throes of fish result in widely gaping mouths and gills, fanned and stiffened fins, and, in extreme cases, arching of the body. Tetany indicates how a fish died. Together with the examination of the disarticulation of fish carcasses, tetany can tell much of post-death history by distinguishing pre-burial scavenging, post-burial bioturbation, disarticulation by water movement, and floating during decomposition. Tetany can occur from respiratory stress, heat shock, salinity or alkalinity shock. Heat shock, being associated with rising temperatures, necessarily results in disintegration of the carcass during floating. Fish dying of salinity shock will exhibit dehydration contortions and a lack of tetany. Therefore, only death from respiratory stress coupled with rapid burial will likely result in widely preserved tetany.

Ferber, C.T. and Wells, N.A., Paleolimnology and taphonomy of some fish deposits in 'Fossil' and 'Uinta' lakes of the Eocene Green River Formation, Utah and Wyoming, Palaeogeography, Palaeoclimatology, Palaeoecology 117(3-4):185-210, 1995.

Also, why were the fish remains not eaten by scavengers, and why are the

enclosing sediments not bioturbated?

Yet the split-fish layer contains well-preserved scavenging organisms such

as fish, turtles and crayfish.


Greenriversoldiersummitbirdprints.jpg


greenriversoldiersummitbirdprints1.jpg


And then there’s the problem of bird tracks. I can’t imagine what bird tracks

are doing in a deep water, anaerobic enviroment?

Bats :-?

icaropic.jpg


platanusleaf.jpg


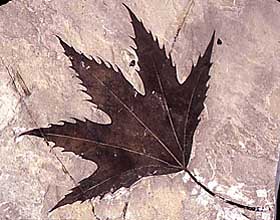
The remarkable preservation of the leaves extends even to microscopic

structures within leaf cells that exhibit beautiful cellular detail. Just as

interesting, the original colour of the leaves has been preserved within the

laminated clays. The original green, brown, or red colours, suggestive of

autumn, are retained, which upon exposure promptly turn black.


Because of the above presented points, I question the idea of varve

formation being an uniform, annual process.

I believe it's reasonable to doubt varve counting is a valid absolute dating

method.
 
The emphasis added in my post was only Korth’s opinions, not Illig’s.

Korth does not say he agrees with Illig’s interpretation, but agrees that Illig

had noted the C14 discrepancy.

Instead, though, you make Illig’s crazy interpretation the strawman, when in

fact my point was there’s evidence of varying C14/C12 ratios in the recent

past.
Far from it. I merely posted my own personal opinion on Illig, i did not link this to Korth in any way. Had i said "Korth says that the years soandso never happened", then that'd be a straw man.
And what was your point again, i honestly must have missed it? I still don't see where on the conference schedule there is supposed invalidity of the calibration methods? Talking about certain details of tree ring records and so on is quite a different thing. Could you highlight the specific points?

23 % just over the last 1300 years (300/1300=23%)
Ugh! Check your math! Even if Korth was right, if something that is 1300 years old is misdated by 300 years, then this does not translate to a 23% change of the C14 ratio. We're dealing with exponential change here...

A sample of 1000 years has 88.6% of its original C14 left, a sample of 1300 years has 85.4% left if both started with equal amounts. That's not quite a 23% difference in C14 content...


And besides:
I think you missed my point. I was stressing that the conference is
addressing the invalidity of current calibration procedures due to varying
historical atmospheric C14/C12 ratios. This is a prediction the Catastrophic
Model makes (i.e.- affirmation), but this is an important instance where
Uniformitarian predictions fail (i.e.- falsification).
What particular catastrophes which are part of the catastrophism model do account for C14 ratio changes of the past thousand years? And where does uniformitarianism assume that C14 ratios are completely constant? Uniformitarianism is the concept that processes worked in the past as they do today, not that nothing ever changed in the environment.


Note that each varve formation is created by the same hypothesized

alternating winter and summer layers.

Why I was pointing out your strawman arguement, is you compared Lake

Zurich’s alternating sequence to Lake Walensee Storm Varves.
You really need to read up on the definition of a "straw man". Am i argueing against a distorted, weaker version of your argument there?

If anything you could accuse me of generalization (something you're quite guilty of yourself as we shall see later), by saying that since storm varves of lake walensee don't look like annual varves of lake zurich, storm varves of green river don't look like annual varves of that location. But what mysterious difference is there between these locations that at green river a chaotic event as a storm supposedly produces layers of sediments that look exactly as neat iterating layers caused by regular processes such as seasonal change?

This was in an attempt to refute my point that Green River’s supposed

annual layers are pentrated by fish and birds, transgressing multiple

“annual†varves.

You attempted to refute my point by setting up Lake Walensee storm

varves as a strawman, when in fact, Green River varves are accepted by

contemporary geologists as an “annual†varve sequence.

I don't think you intended to do this, but the

result still was a strawman response.
So where do these contemporary geologists say that every single varve in green river is an annual one? Contemporary geology is well aware of things like local catastrophes. And even if such fossils penetrate annual layers, that's still not a problem as your refutation fails clearly, as well shall see later.

I also notice a clear double standard here...you brought up the green river varves as a response to the lake suigetsu situation, didn't you? So how can you then try to deny me to bring up walensee and zurüch as a response to green river?

Fish should not remain intact while very thin varves are slowly being

deposited around them. Even in anaerobic waters, one would not expect,

say a catfish with a 5†diameter (small to medium sized fish) to not decay

for 5 years.
How about swamp mummies? They make it for thousands of years in an anaerobic environment.

If so, there would be many, many more catfish in the varves, especially

intepreting the varves as forming over millions of years. The fossil record in

these varves does not support this hypothesis.
Could you be more specific? I don't see your point.

In the Green River Formation ‘evaporites are succeeded by laminates

bearing fresh water fish fossils but barren of autochthonous benthic [natural

bottom] fossils’.

Boyer, B.W., Green River laminites: does the Playa-Lake Model really invalidate the Stratified-Lake Model? Geology 10(6):321-324, 1982, and references cited therein.
So?

The next one:
In regards to the fossil fish of the Green River Formation, or any formation for that matter, fish taphonomy can aid in refining environmental interpretations. This is because modern analogues indicate that fossil preservation can be traced to several fairly recognizable conditions. Tetany is the extreme contraction of muscles during death, and indicates traumatic death. The muscular contractions of the death throes of fish result in widely gaping mouths and gills, fanned and stiffened fins, and, in extreme cases, arching of the body. Tetany indicates how a fish died. Together with the examination of the disarticulation of fish carcasses, tetany can tell much of post-death history by distinguishing pre-burial scavenging, post-burial bioturbation, disarticulation by water movement, and floating during decomposition. Tetany can occur from respiratory stress, heat shock, salinity or alkalinity shock. Heat shock, being associated with rising temperatures, necessarily results in disintegration of the carcass during floating. Fish dying of salinity shock will exhibit dehydration contortions and a lack of tetany. Therefore, only death from respiratory stress coupled with rapid burial will likely result in widely preserved tetany.

Ferber, C.T. and Wells, N.A., Paleolimnology and taphonomy of some fish deposits in 'Fossil' and 'Uinta' lakes of the Eocene Green River Formation, Utah and Wyoming, Palaeogeography, Palaeoclimatology, Palaeoecology 117(3-4):185-210, 1995.
Ok...so what? So some fish fossil deposits there were the result of relatively rapid burial. What is this supposed to prove? No one denies that this occasionally happens. To leave an impression, you need to demonstrate that exactly these fossils were buried under what is thought to be annual layers. Then you have a case, before that not at all.

Also, why were the fish remains not eaten by scavengers, and why are the
enclosing sediments not bioturbated?
Yet the split-fish layer contains well-preserved scavenging organisms such

as fish, turtles and crayfish.
Because exactly those scavengers don't do so well in anaerobic environments either. Guess what could have killed and preserved exactly those scavengers too... Or, if the anaerobic environment didnt kill them but merely deterred them, they easily could have died in higher more aerobic parts of the lake and sunk down to the ground.

I don't get your point about the bioturbation. What exactly is supposed to be the problem?

And then there’s the problem of bird tracks. I can’t imagine what bird tracks

are doing in a deep water, anaerobic enviroment?
Again, green river is a huge formation. There are deep parts and shallow parts. If you find such bird tracks right next to poly-annual-varve fish fossils, then you have a case; bird tracks just from somewhere don't cut it.

I believe it's reasonable to doubt varve counting is a valid absolute dating

method.
Again, then what exactly put it off in lake suigetsu in such nice correlation with C14 dating, and why did the very same thing happen in another lake on the other side of the earth? And what casued the millions of nice layers if there is only ~4400 years for this and we see them forming at a rate of one per year, rarely two per year?

PE-04L.gif

Open circles from a lake in Poland, closed circles from lake suigetsu of Japan.

What neccessarily non-noachian-flood mechanism is responsible for this?
 
C14-Dates inaccurate - Calibration procedure disproved
Added: (Tue Apr 11 2006)


The content of radiocarbon allows to determine the age of organic material - after calibration with an empirically found, highly irregular 'calibration curve'. The physicist Hans-E. Korth, a pensionist from IBM-Research, has given proof that the assumptions for the actual calibration curve are in conflict with the observations of physics and the laws of statistics. Participants of the 19th 14C Conference being held at Oxford last week acknowledged his open letter questioning half a century's work of the scientists.


Dramatic variations of C14 within the atmosphere which had been presumed are incompatible with a physically conclusive interpretation of the measured data. Korth shows the strange consequences of this assumption for the production of C14. He presents more evidence displaying the very unlikely apparent interdependency between C14 in the atmosphere and the temperature on the Earth's surface.
Additional proof
gives a look at the deviation between the C14 age values from sediments, in comparison to those from wood. Then there is the extremely uneven age distribution of wood-sample inventories. "Secular variations of C14 were considered real," explains Korth, "while the bizarre consequences of calibration were ignored: Samples of wood from the middle-ages distribute uniformly along the time-axis, when calibration is omitted.
After calibration, the sample distribution shows so large variations that a coincidence must be excluded. Another example: C14 is produced by the radiation of our sun. The consequence of the apparent C14-variations were three distinct radiation levels for the sun, switching from one
into an other after a few decades. Do we need to believe this?"

The consequences of these findings are crucial for science: A first conclusion will be that the observed deviations of C14 dates are due to mismatches of tree-ring sequences within dendrochronology, as both methods are linked by the calibration process. Investigations indicate that today's dendrochronologies include a surplus of some 300 tree-rings.

This confirms the much disputed hypothesis of H. Illig. For more than 15 years, the German chronologist has addressed the complete lack of reliably dated artefacts from the three 'dark' centuries of the early middle-ages and many other observations, leaving no other conclusion than to deny the historical reality of this period.

The general implications of this discovery should not be underestimated: For most of us, it may be not really important whether Charlemagne, for example, has ever lived. However, to predict the accelerating warm-up of the Earth's climate reliably, accurate data from the past are needed. These are of prime importance for upcoming political decisions.


More Infos:
http://www.korthweb.de/PhZT/An_open_let ... rence.html
(For verification, please ask a physicist for his explanation of the itemised facts and data)

Programme & contributors: http://www.rlaha.ox.ac.uk/c14/conference19/prog.html
FAQ on critical chronology of the early middle-ages http://www.PhZT-FAQ.de.vu

Contact: H-E. Korth, korth@t-online.de
Sandbergerstr. 34, D-70184 Stuttgart, Germany


jwu:

That man is a well known crackpot...conspiracy theory galore. Basically, according to him, the europeans could convince the Chinese, Muslims, Hindus and Hebrews to skip 300 years in their calenders as well. And who cares if there are hardly any relics from the dark ages as long as the years were counted and there are tons of things older than that which were dated correctly. Apparently those 700A.D. conspirators also had the know how to put the datings of all not even yet dug out Roman artifacts off by 300 extra years...e.g. the Ar/Ar dating of the destruction of pompeji, known to have occured in 79AD, which gave a result only 7 years off.


charlie:

Strawman?


jwu:

How so? Please be detailed. I think it's a conclusive falsification of Illig's ideas.


charlie:

The emphasis added in my post was only Korth’s opinions, not Illig’s.

Korth does not say he agrees with Illig’s interpretation, but agrees that Illig

had noted the C14 discrepancy.

Instead, though, you make Illig’s crazy interpretation the strawman, when in

fact my point was there’s evidence of varying C14/C12 ratios in the recent

past.


The link that you read and to which you referred had the following topics of

discussion scheduled for the 19th International 14C Conference:

1. C14 concentrations of consecutive 40 single-yr tree rings at a peak area in the excess region between 2800 and 2625 cal BP using AMS.
2. Variations in atmospheric 14C during the Younger Dryas from Huon pine tree rings in Tasmania
3. Is it possible to find a good point estimate of calibrated radiocarbon date?
4. Wiggle-matching 14C-dating of historical materials and the systematic error consideration.
5. Exploring the potential causes of atmospheric Δ14C variation using multi-proxy evidence from Bahamian speleothems (34 to 45 ka)
6. Δ14C of Atmospheric CO2 over the Subtropical and Equatorial Pacific from Fall 2002 to Winter 2004
7. Atmospheric 14CO2 changes in the equatorial zone of western Pacific since 1994
8. Two decades of regular observations of 14CO2 and 13CO2 content in atmospheric carbon dioxide in central Europe: long-term changes of
regional anthropogenic CO2 emissions.
9. Radiocarbon ?Wiggles? in Great Lakes wood c. 10,000 to 12,000 BP.
10. Forty years of atmospheric radiocarbon variation studies in Slovakia.
11. North Atlantic surface ocean radiocarbon reservoir age variation: links to rapid global climate change
12. A radiocarbon shift in the eastern tropical Pacific during the early 19th century - oceanic response to atmospheric forcing?
13. Large 14C fluctuations in core PS2644 between 55 and 80 cal ka BP: Real or not?
14. Radiocarbon changes in the Northeast Atlantic Ocean over the past 50 years
15. What do carbon isotopes tell us about the age and source of CO2 lost by evasion from surface waters draining peatlands?
16. Monitoring of atmospheric excess 14C around Paks NPP

Here’s the link again for convenience:

http://www.rlaha.ox.ac.uk/c14/conference19/prog.html

So, in summary, and to answer your question at hand:

You did not refute my point. Instead, you set up Illig’s crazy interpretations

as a strawman.

My point was that the conference is addressing the invalidity of current

calibration procedures due to varying historical atmospheric C14/C12 ratios.

This is a prediction the Catastrophic Model makes (i.e.- affirmation), but

this is an important instance where

Uniformitarian predictions fail (i.e.- falsification).


jwu:

Far from it. I merely posted my own personal opinion on Illig, i did not link this to Korth in any way. Had i said "Korth says that the years soandso never happened", then that'd be a straw man.
And what was your point again, i honestly must have missed it? I still don't see where on the conference schedule there is supposed invalidity of the calibration methods? Talking about certain details of tree ring records and so on is quite a different thing. Could you highlight the specific points?

You could also take a quote out of context, and present that as your fellow

debater’s point, attacking and refuting that ill conceived point instead of the

intended point, which, in this instance was the title of the article:

“C14-Dates inaccurate - Calibration procedure disprovedâ€Â. It’s not an article

on conspiracy theorys.


jwu:

Open circles from a lake in Poland, closed circles from lake suigetsu of Japan.

What neccessarily non-noachian-flood mechanism is responsible for this?

Again, all this proves is that C14 is a good relative dating tool. It says

nothing as to absolute dates. To determine which sequences should match

for each lake, C14 is used. Note, also, the relative dates are off by at least

several centuries in many, many cases.


Sorry about the slow responses. It's been pretty busy here lately.

I'll try to answer you next couple of points by this weekend.

Hope your week is going well...
 
I also notice a clear double standard here...you brought up the green river varves as a response to the lake suigetsu situation, didn't you? So how can you then try to deny me to bring up walensee and zurüch as a response to green river?

The Green River and Lake Suigetsu formations we're discussing are considered

annual varves by contemporary, uniformtarian geologists. For you to throw

storm varves into the mix makes no sense.
 
You could also take a quote out of context, and present that as your fellow

debater’s point, attacking and refuting that ill conceived point instead of the

intended point, which, in this instance was the title of the article:

“C14-Dates inaccurate - Calibration procedure disprovedâ€Â. It’s not an article

on conspiracy theorys.
Where did i take this out of context and present it as your point? I've commented on it as a slightly off topic side issue nothing more.

In terms of Korth's article there is nothing i need to refute. It doesn't help your case at all (well...except that some things might have been dated 300 years too old, big deal), and quite oppositely states that the variations of the C14/C12 ratio are actually lower than thought by mainstream science.
I have no idea how the author of that pressbox.co.uk article got from korth's work that the calibration procedure supposedly was "disproved" or anything like that. Korth states this:
I) Physical evidence and statistics disprove the current hypothesis that assumes substantial secular variations of 14C/12C. These must be much smaller than what has been concluded from Intcal calibration, because...

He proposes that if one removes three centuries from the records, then one gets an even nicer calibration curve with less "wiggles" than is currently used.


Again, all this proves is that C14 is a good relative dating tool. It says

nothing as to absolute dates. To determine which sequences should match

for each lake, C14 is used.
How so? Please be detailed.

I don't think C14 is used there at for anything else than drawing the graph. The varves are counted, organic matter found in them is dated with C14 and the C14 (uncalibrated) age is entered in the chart at the varve count on the X axis. That's all.

How does this depend on the validity of C14 dating? And if something is off there, what caused this to occur in at least two different lakes on opposite sides of the earth and in nice proportion to whatever put C14 off? Please comment on that in your next reply, it's a key issue.

Note, also, the relative dates are off by at least

several centuries in many, many cases.
No-one expects all ages to be perfect, occasional cases of contamination are expected.

The Green River and Lake Suigetsu formations we're discussing are considered
annual varves by contemporary, uniformtarian geologists. For you to throw
storm varves into the mix makes no sense.
No one claims that there are exclusively annual varves - i merely only pointed out that the non-annual ones such as the ones caused by disturbance of the water and slit by storms can be distinguished from the annual ones.

However, let me remind you that it was you who brought up things like storms in this context first:
"...but a huge lake without disruptive storms or variable river input, year after year for six million years? Surely some things cannot be..."

What do you make of this quote by Dr. John Morris?

Sorry about the slow responses. It's been pretty busy here lately.
I'll try to answer you next couple of points by this weekend.
Hope your week is going well...
Sure, just take your time.
 
He proposes that if one removes three centuries from the records, then one gets an even nicer calibration curve with less "wiggles" than is currently used.

I think he was making the point that the calibration is off. He notes that if you

remove the calibration, and plot the dates in the subject area, the dates

tighten up along the curve again.


I don't think C14 is used there at for anything else than drawing the graph. The varves are counted, organic matter found in them is dated with C14 and the C14 (uncalibrated) age is entered in the chart at the varve count on the X axis. That's all.

How does this depend on the validity of C14 dating? And if something is off there, what caused this to occur in at least two different lakes on opposite sides of the earth and in nice proportion to whatever put C14 off? Please comment on that in your next reply, it's a key issue.

Just like tree rings, extended chronologies based on varve counting are

matched up based on C14, and then similar strata are compared.

The entire sequence doesn't actually exist, because of uncomformities,

etc...


Sorry about the very slow response. I've had several researchers asking for

a bunch of different data from the site I've been studying.

Looks like it's slowed down in here since summer began...
 
Back
Top